
Critical points (3D)
f(x,y) = x³ − 3x + xy² with two extrema and two saddle points — the Hessian classifies each point automatically.
Analysis (multivariable)Try itVisuApps
Visualise functions of several variables and their extrema
Apps
f(x,y) = x³ − 3x + xy² with two extrema and two saddle points — the Hessian classifies each point automatically.
Analysis (multivariable)Try it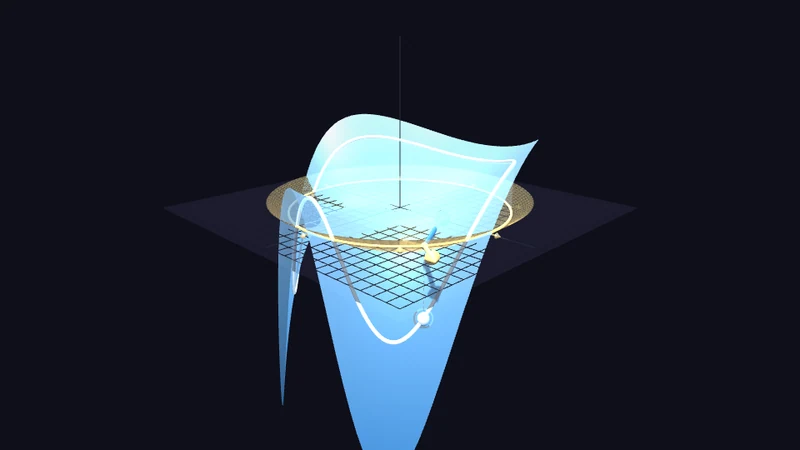
Extrema under a constraint — a walking path on the function graph, gradient vectors of f and φ live, λ readable directly.
Analysis (multivariable)Try it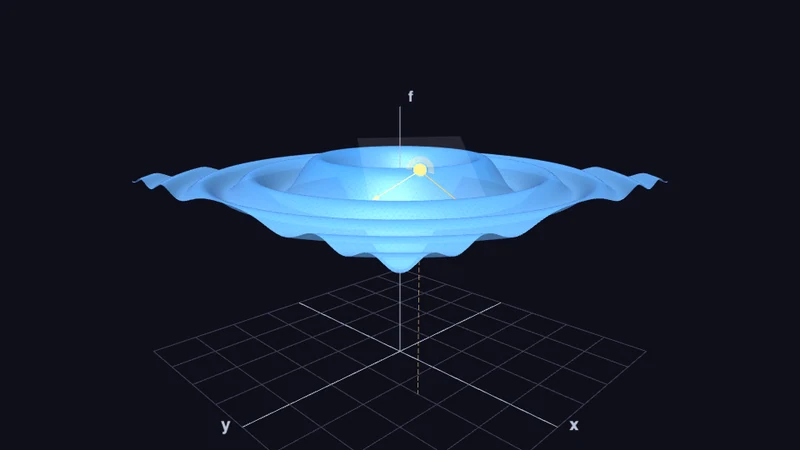
Function f(x,y) as a 3D surface — drag the point, see tangent vectors and find extrema.
Analysis (multivariable)Try it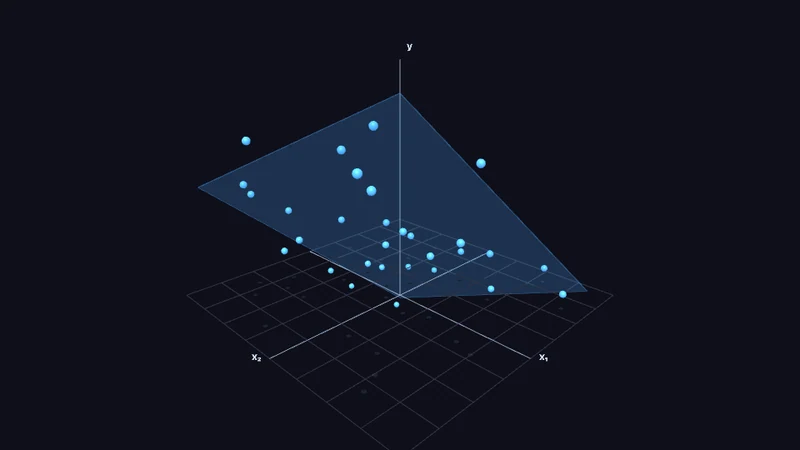
Explore point cloud and regression plane interactively — drag points, mix data, reveal residuals.
Analysis (multivariable)Try itWant to use these apps in your courses? Let’s find out what works for you.
One form, three matters. We answer personally.
We show heyprof on your own material. Tell us what you teach and we will prepare the conversation around it.