All apps. Free in your browser.
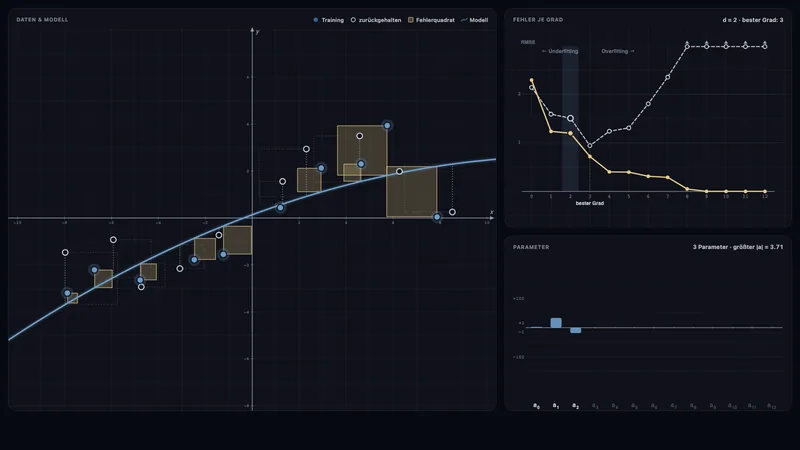
Curve-fitting playground
A model is a form with parameters: polynomials of degree 0 to 12 by least squares, residuals as squares (area = loss), held-out error over the degree and parameters that explode when overfitting.
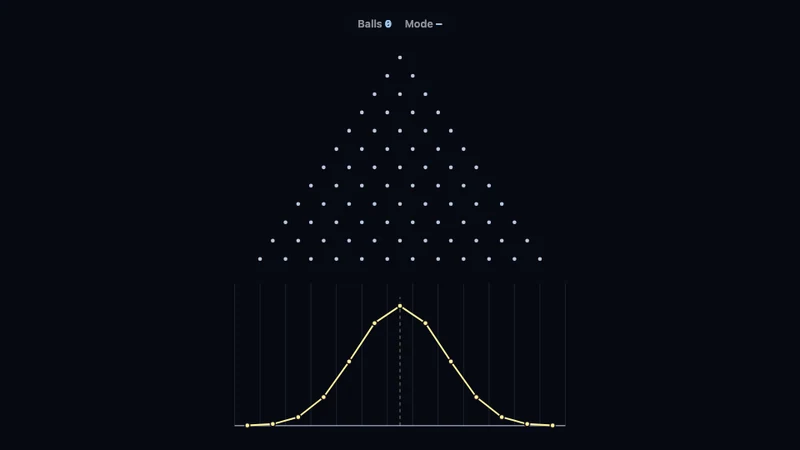
Probability & statisticsTry itGalton board
Watch balls bounce through pegs and form a histogram. Adjust row count and probability and compare the result with the theoretical binomial distribution.
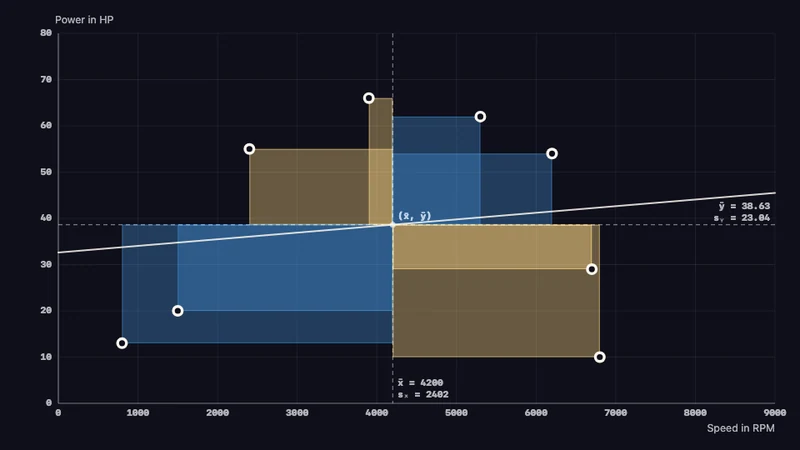
Probability & statisticsTry itCovariance & Regression
Eight draggable data points — signed rectangles around the means make covariance and the regression slope visible, including correlation sign and magnitude.
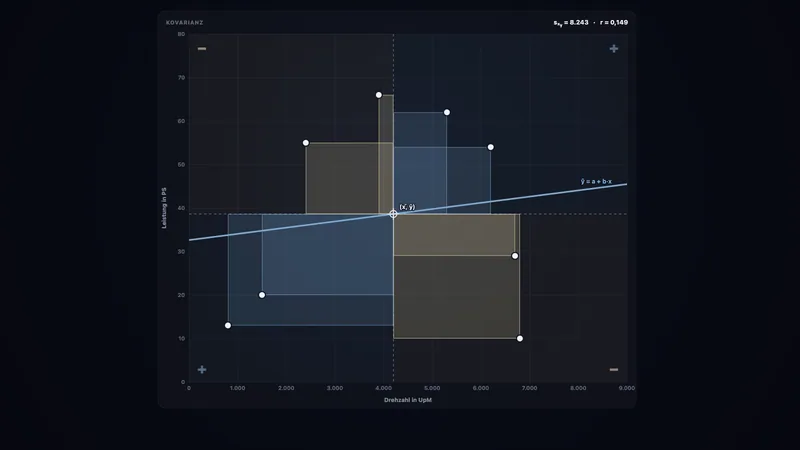
Probability & statisticsTry itCovariance & regression 2.0
Rebuild 2.0 (preview): covariance as rectangle areas around the centroid, switchable units, least squares as real squares, both regression lines.
Probability & statisticsTry itCoin flips: law of large numbers
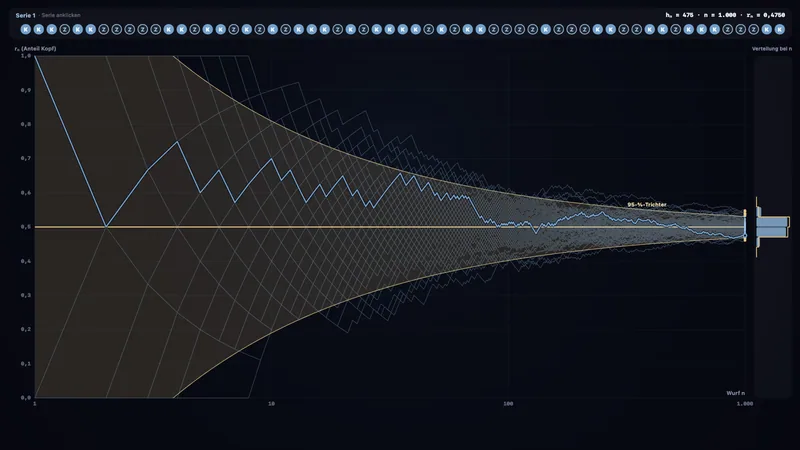
Many coin-flip runs at once: the relative frequency runs into the narrowing 95 % funnel, while the absolute heads surplus widens it — with exact values, the binomial distribution and the gambler's fallacy after 10 heads.
Probability & statisticsTry itSpray a Point Cloud
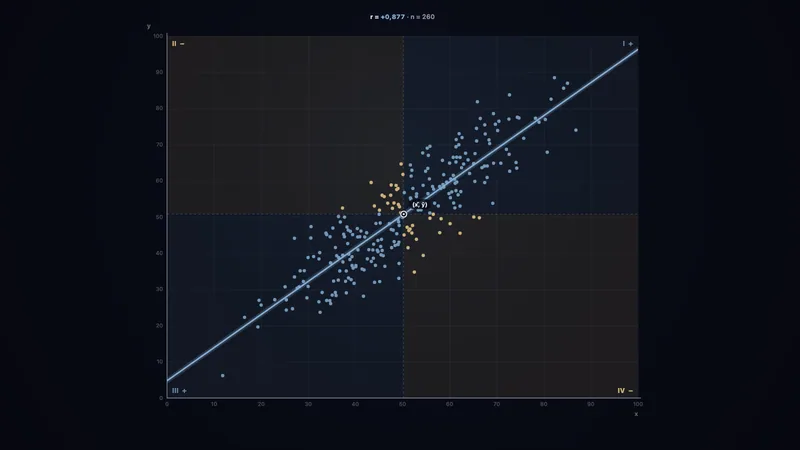
Spray, erase or place points one by one: quadrants show the covariance as signed rectangles, plus r, Spearman, R², two regression lines and examples where r misleads (U shape, outlier, two groups).
Probability & statisticsTry itRegression & R²
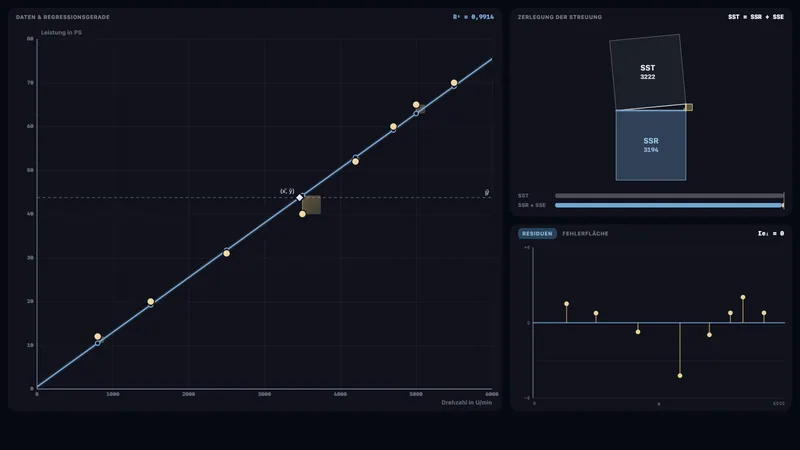
Least-squares line on lecture data: errors as squares, SST = SSR + SSE as a right triangle, SSE as a bowl over slope and position; Anscombe, a parabola and a confounder show what R² does not reveal.
Probability & statisticsTry itMonty Hall problem
Three, ten or a hundred doors: probability visibly flows onto the door the host leaves shut — plus a Bayes table, a tree, an ignorant host and the strategies always switch, never switch, 50/50 simulated thousands of times.
Probability & statisticsTry it