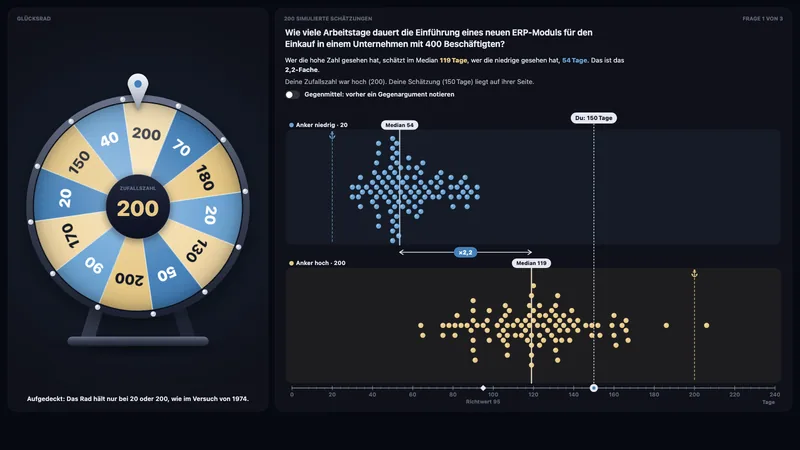
Anchoring effect
A wheel of fortune gives a random number, then you estimate a question from working life. 200 simulated colleagues show how strongly the number pulls the estimates and what a counterargument does against it.
Data & decisionsTry itVisuApps
Statistical pitfalls and decision anomalies from "Data & Decisions" — intuitive and interactive.
Apps
A wheel of fortune gives a random number, then you estimate a question from working life. 200 simulated colleagues show how strongly the number pulls the estimates and what a counterargument does against it.
Data & decisionsTry it
Number forensics on the first digit: data points land on a glass log drum whose sector width is log₁₀(1+1/d). Rescaling only turns the drum; body height and .99 prices fail, manipulated expenses give themselves away (Nigrini MAD, χ²).
Data & decisionsTry it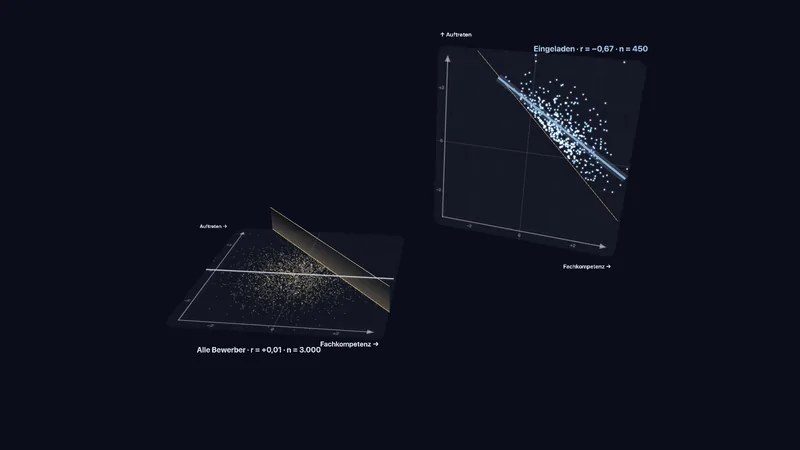
The filter invents the relationship: a light wall sweeps through 3,000 independent applicants, the selected fly onto a stage — and there the regression line falls (r ≈ −0.67). Sum, or, and, causal diagram with collider.
Data & decisionsTry it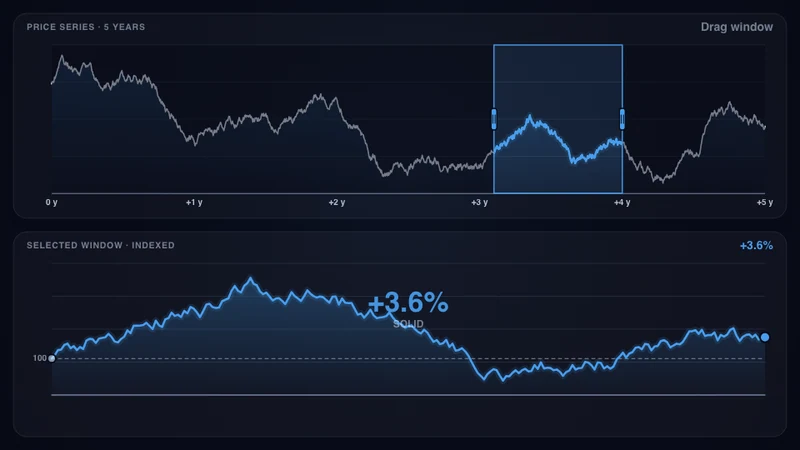
Drag a time window over a price series — the same stock looks "great" or "catastrophic". Toggle the index base; the sales-succession case shows how the reference period alone flips the promotion decision.
Data & decisionsTry it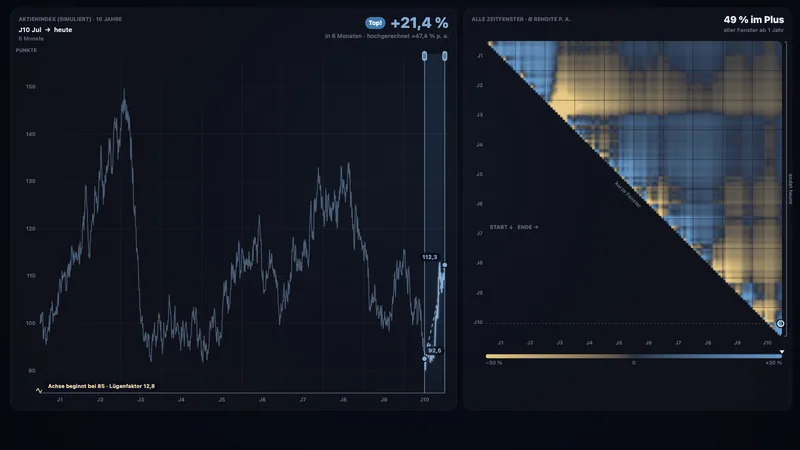
Rebuild 2.0 (preview): the same series, every start–end pair as a triangle of returns, distribution of all windows, rebasing to 100 and axis tricks.
Data & decisionsTry it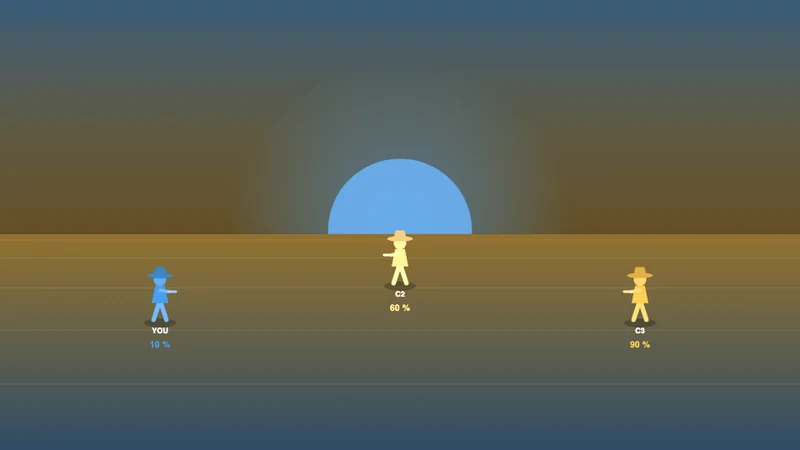
You only hit with 10 % — whom to aim at? A Monte-Carlo simulation shows: deliberately firing into the air maximizes your survival chance, because the two strong opponents thin each other out first.
Data & decisionsTry it
Rebuild 2.0 (preview): 3D truel with exact survival probability per strategy, Monte Carlo with confidence funnel, selectable turn order and a map of when firing into the air is optimal.
Data & decisionsTry it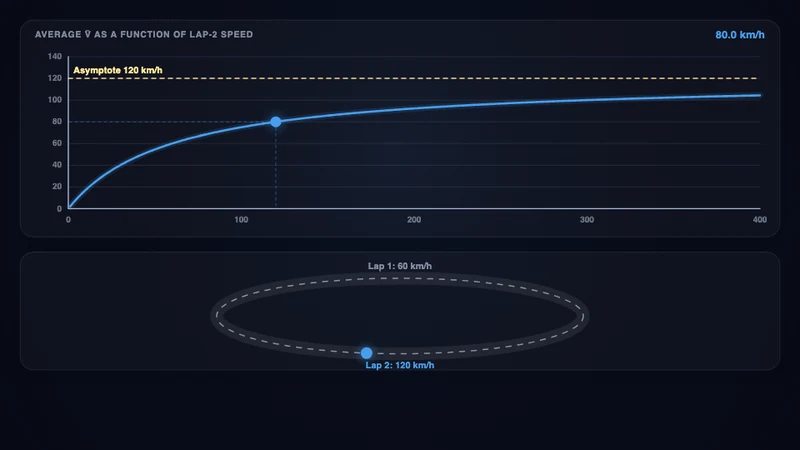
Arithmetic, geometric, harmonic — which one when? The speed paradox (the second lap is never fast enough for a 120 km/h average), the inequality AM ≥ GM ≥ HM on a number line, and the cost-averaging effect in a savings plan.
Data & decisionsTry it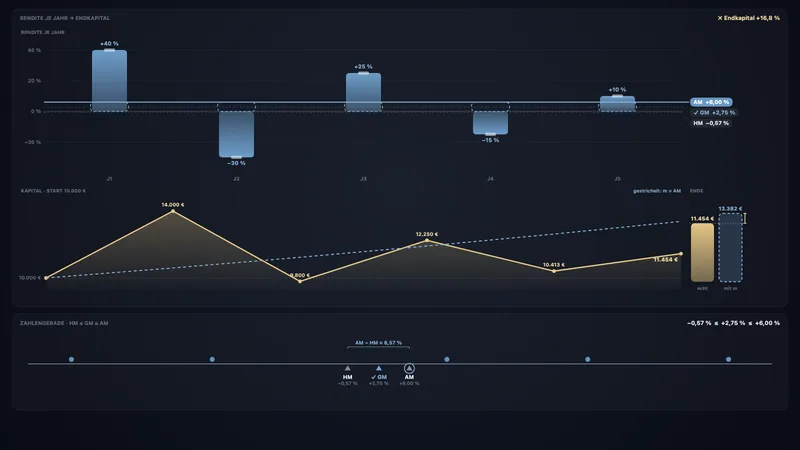
Rebuild 2.0 (preview): which constant value replaces them all? Returns, speed, savings plan, P/E and semicircle — AM, GM, HM in the replacement test, HM ≤ GM ≤ AM on the number line.
Data & decisionsTry it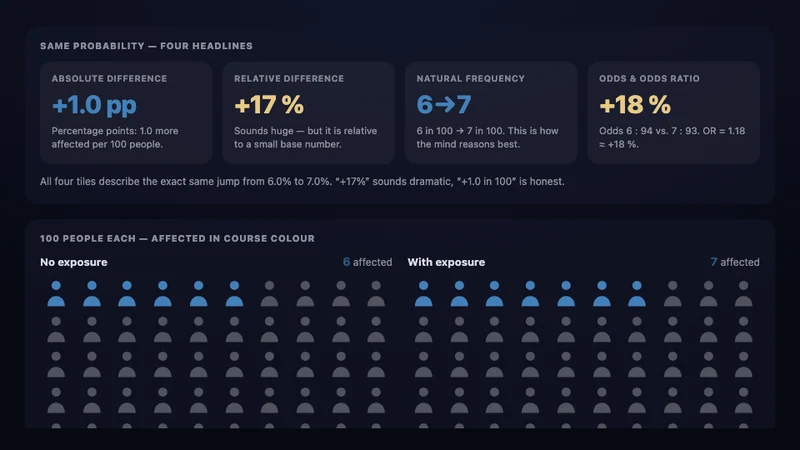
Same number, four readings: absolute vs. relative risk difference, natural frequency and odds ratio — with icon arrays of 100 figures. Plus the fight over the right base (O. J. Simpson, suicide rate).
Data & decisionsTry it
Rebuild 2.0 (preview): the same risk as relative and absolute risk, natural frequency, odds and betting odds.
Data & decisionsTry it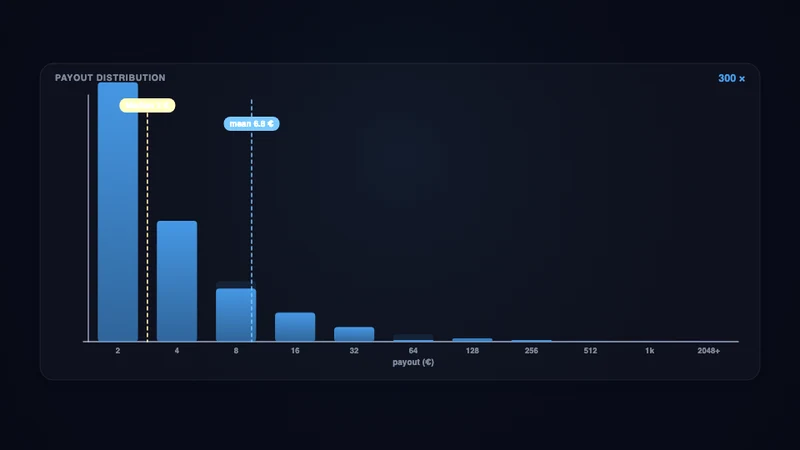
The St. Petersburg paradox (expected value ∞, yet nobody pays much), Bernoulli utility functions with certainty equivalent (insurance vs. lottery), and the S-shaped prospect value function with loss aversion.
Data & decisionsTry it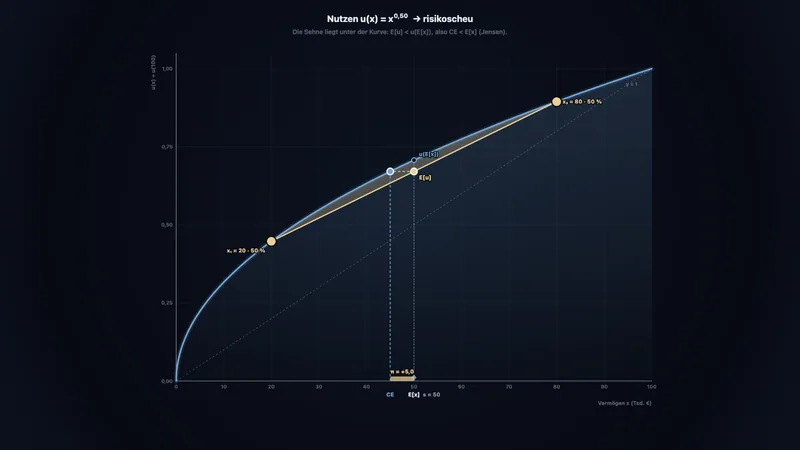
Rebuild 2.0 (preview): St. Petersburg paradox, utility x^γ with certainty equivalent, prospect theory with loss aversion.
Data & decisionsTry it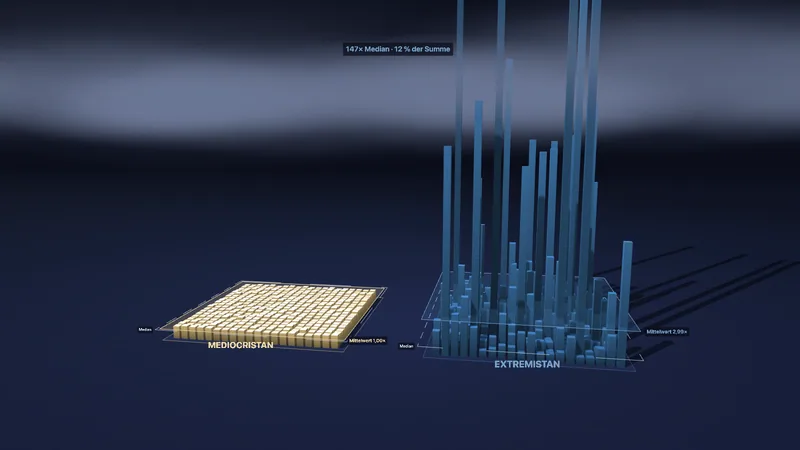
Two 3D cities from the same random numbers: uniform body heights against a Pareto skyline whose tallest tower pierces the clouds. α slider, running mean, log-log tail, Lorenz curve, the one-in-a-million outlier.
Data & decisionsTry it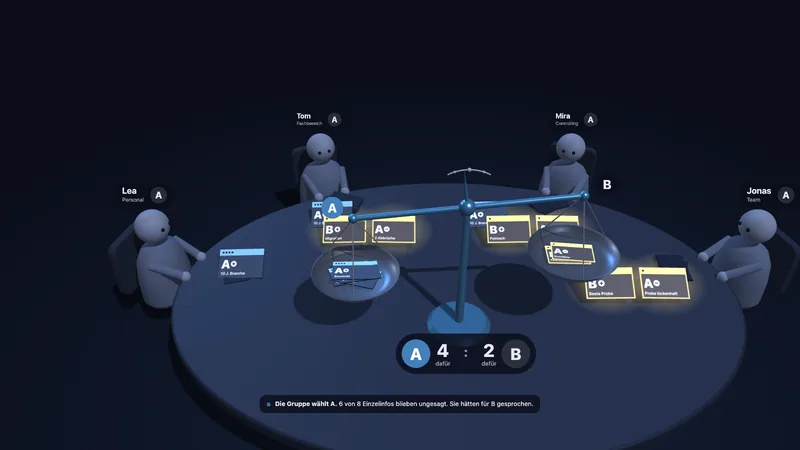
Four people decide on a team lead, each holding their own info cards. The balance shows why the group makes the worse choice and how asking for unique information in turn changes that.
Data & decisionsTry it
Rebuild 2.0 (preview): live headline against reality, population mosaic with case dots, age structure as confounder up to reversal, Farrington's screening method.
Data & decisionsTry it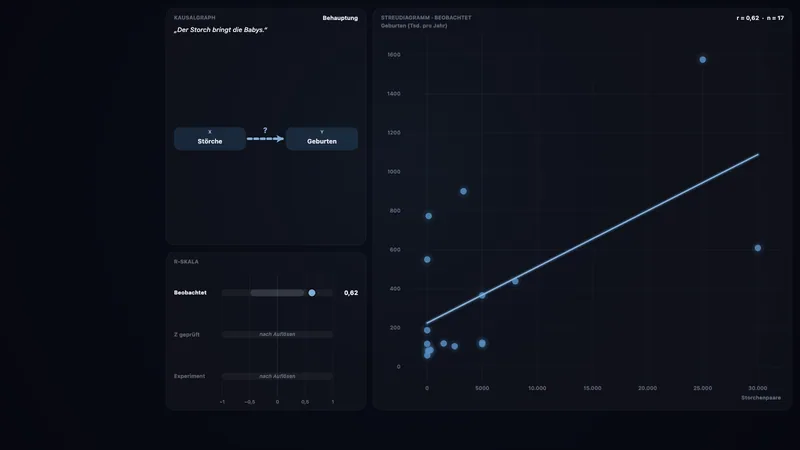
Seven cases from storks to Nicolas Cage: guess the structure, then use partial correlation and an experiment to test what produces the correlation – third factor, direction, selection or chance.
Data & decisionsTry it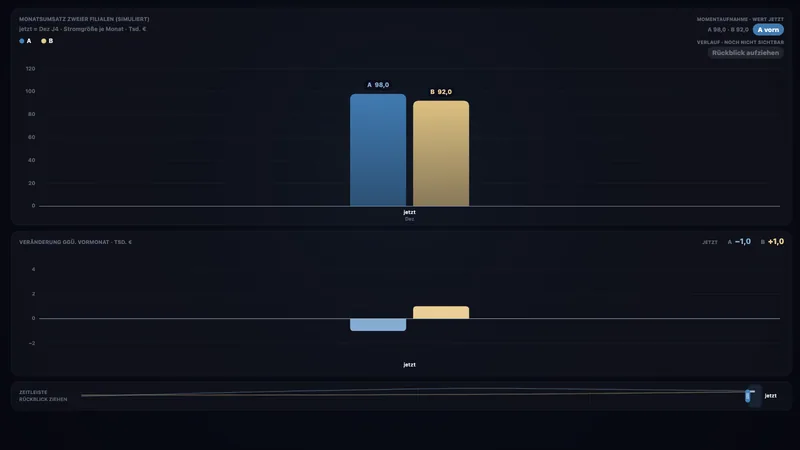
Rebuild 2.0 (preview): the slide says “A ahead” — opening the look-back morphs the bars into lines and the trend verdict flips. Prior month vs. same month last year, crossings, stock vs. flow.
Data & decisionsTry it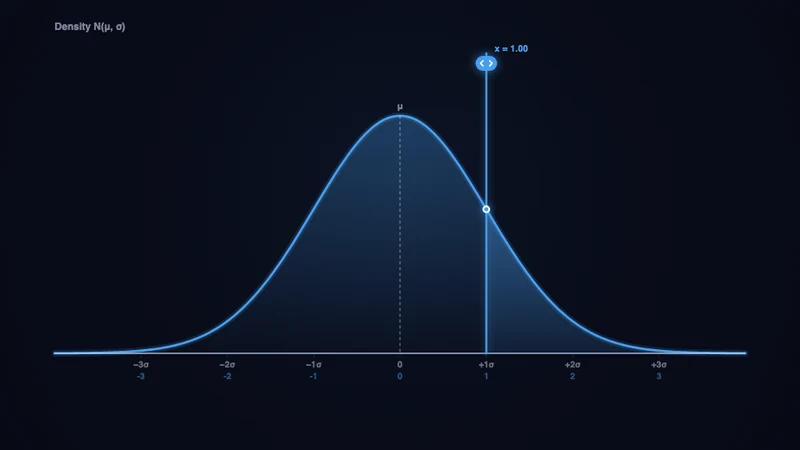
Bell curve N(μ,σ): drag μ and σ, drag the threshold x directly → z-score and tail probability P(X>x) live, with shaded area. The 68-95-99.7 rule as bands; presets for US male height with "taller than LeBron/Yao Ming?".
Data & decisionsTry it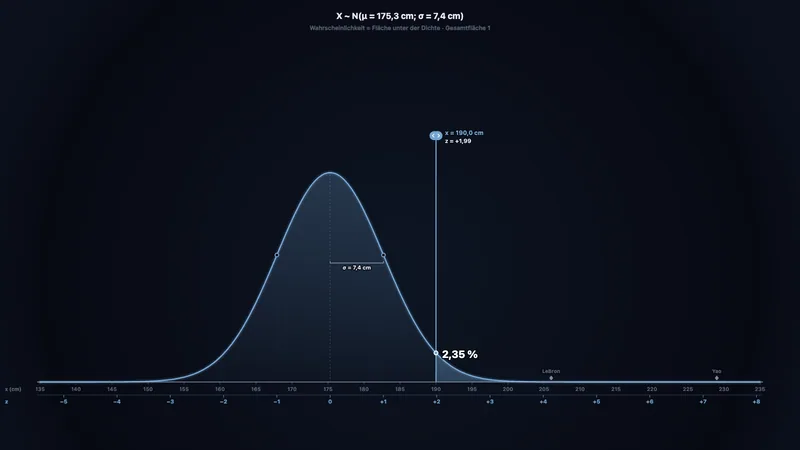
Rebuild 2.0 (preview): bell curve morphing X → Z with the same area, tail and interval probabilities, inverse quantile question, sampling and a men/women comparison.
Data & decisionsTry it
Give a 90 % interval for each of ten estimation questions. Calibrated would be nine hits — most manage far fewer. Interval bars with the true answer expose the overconfidence.
Data & decisionsTry it
Coin sequences are non-transitive: for every three-flip sequence there is one that beats it on average. Pick sequences, watch the coin stream live, simulate 1000 games — win rates and mean waiting times (8 vs. 10 flips).
Data & decisionsTry it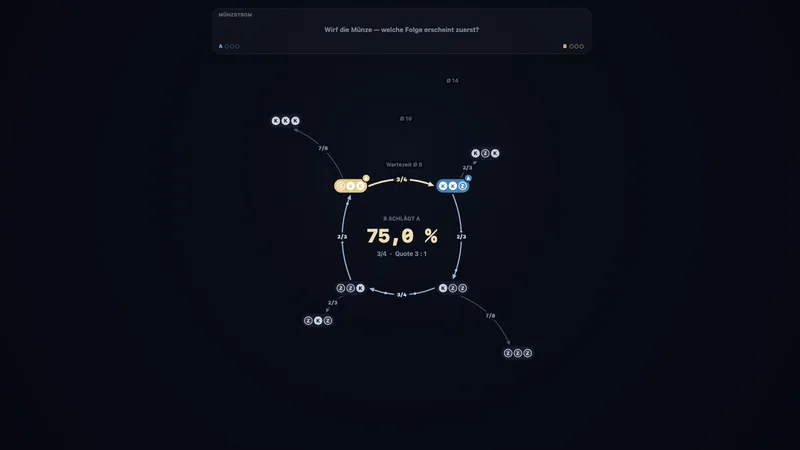
Rebuild 2.0 (preview): exact odds via Conway, non-transitivity as a graph on waiting-time rings, waiting-time paradox, matrix of all duels, Monte Carlo, length 3 and 4.
Data & decisionsTry it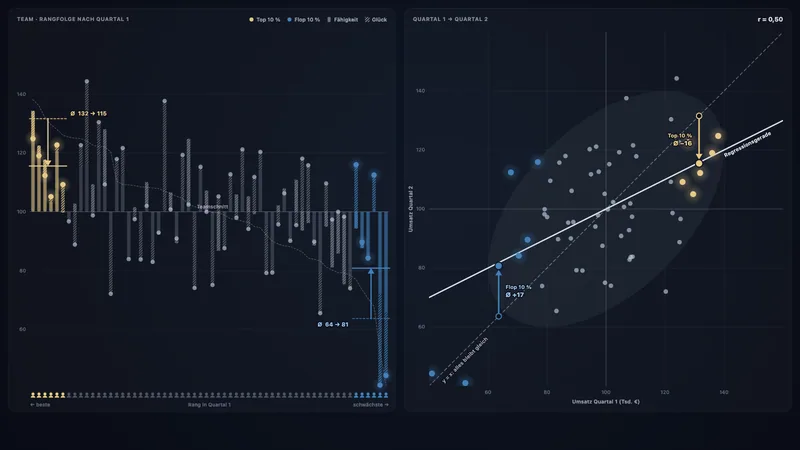
A sales team across two quarters: the best fall back and the weakest catch up without anyone changing anything. A slider for the share of luck shows when this happens and how strongly.
Data & decisionsTry it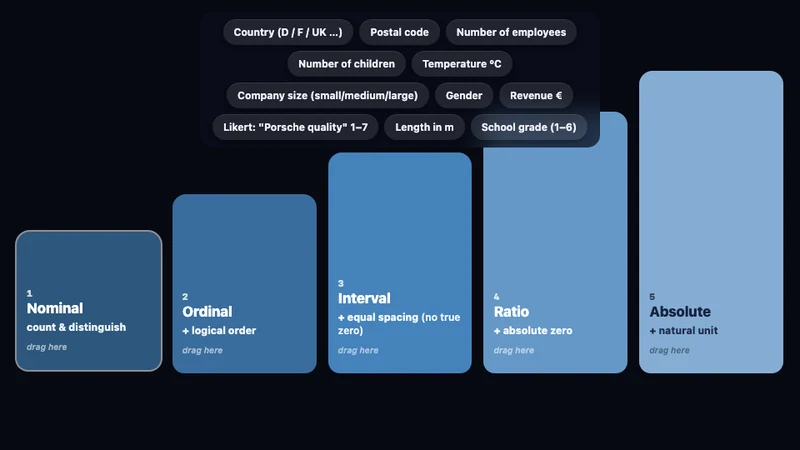
Drag variables into the five levels of measurement (nominal → ordinal → interval → ratio → absolute). Each step adds a property; the operations panel shows which statistic is allowed from which level — mean from interval, ratio from ratio level.
Data & decisionsTry it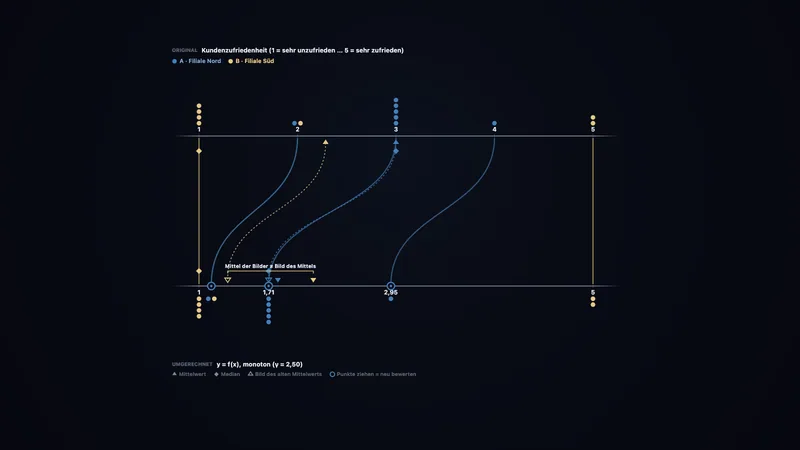
Rebuild 2.0 (preview): level of measurement as the set of admissible transformations — five statements hold or flip live, ladder of permitted statistics, sorting exercise with 19 variables.
Data & decisionsTry it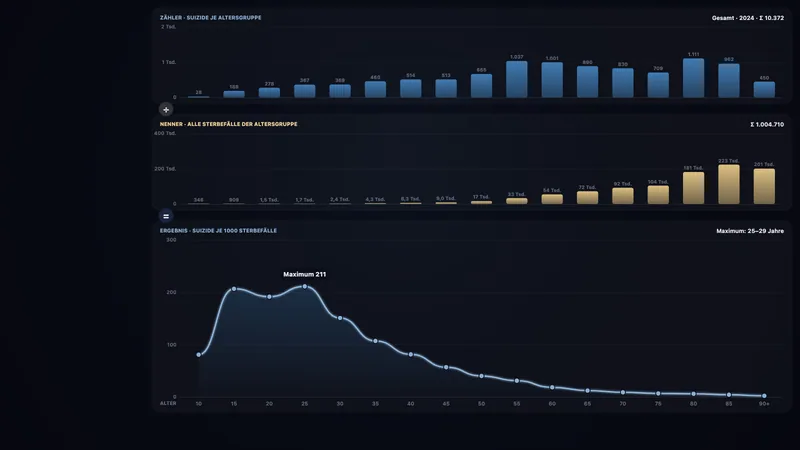
The same Destatis data, three denominators: suicides per death, per all suicides and per resident give three correct curves telling three stories.
Data & decisionsTry it
Abraham Wald’s bombers: fly missions, analyse only the survivors and reveal the losses — with an armor comparison, Wald’s inference of vulnerability and a fund database as transfer.
Data & decisionsTry it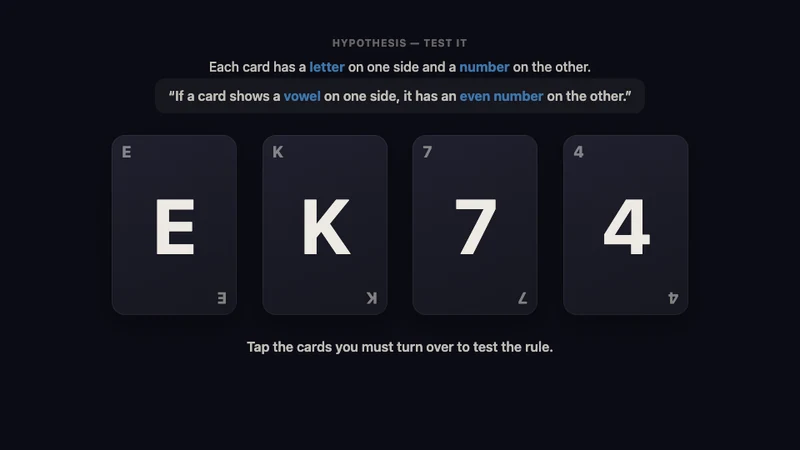
E, K, 7, 4 — which cards must you turn over to test the rule? The classic confirmation bias, plus the everyday scenario (beer/cola/16/22) that almost everyone solves correctly.
Data & decisionsTry it
Rebuild 2.0 (preview): five scenarios from abstract to invoice audit, flipped cards land in the truth table, resolution with your own choice pattern and an SQL query.
Data & decisionsTry it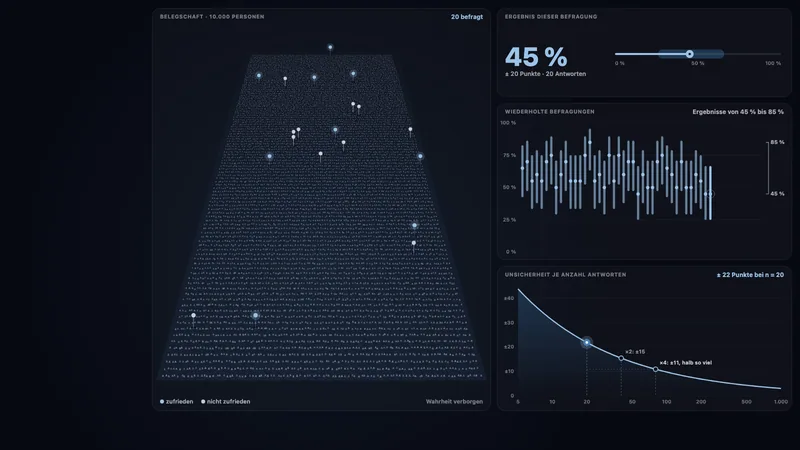
One workforce, many surveys: see how far results jump with few answers and why it takes four times as many answers to halve the uncertainty.
Data & decisionsTry itWant to use these apps in your courses? Let’s find out what works for you.
One form, three matters. We answer personally.
We show heyprof on your own material. Tell us what you teach and we will prepare the conversation around it.